Identification of Memory Leaks
Memory leaks are real headaches. As long as product is in development, everything is cool and smooth. Once we roll it to production we see the real face of the devil. With sufficient load testing or with a potion of actual traffic, we can identify this issues beforehand. So here I am going to talk about how to find memory leaks in Java applications - might be deployed in a VM or in a docker container.

Most of the time if there is a memory leak we get OutOfMemoryError (OOM). There are different kinds of OOM. Lets read on them. But most of the time we get OOM as Exception in thread thread_name: java.lang.OutOfMemoryError: Java heap space. This is most probably because of a memory leak.
Tunnelling to JVM
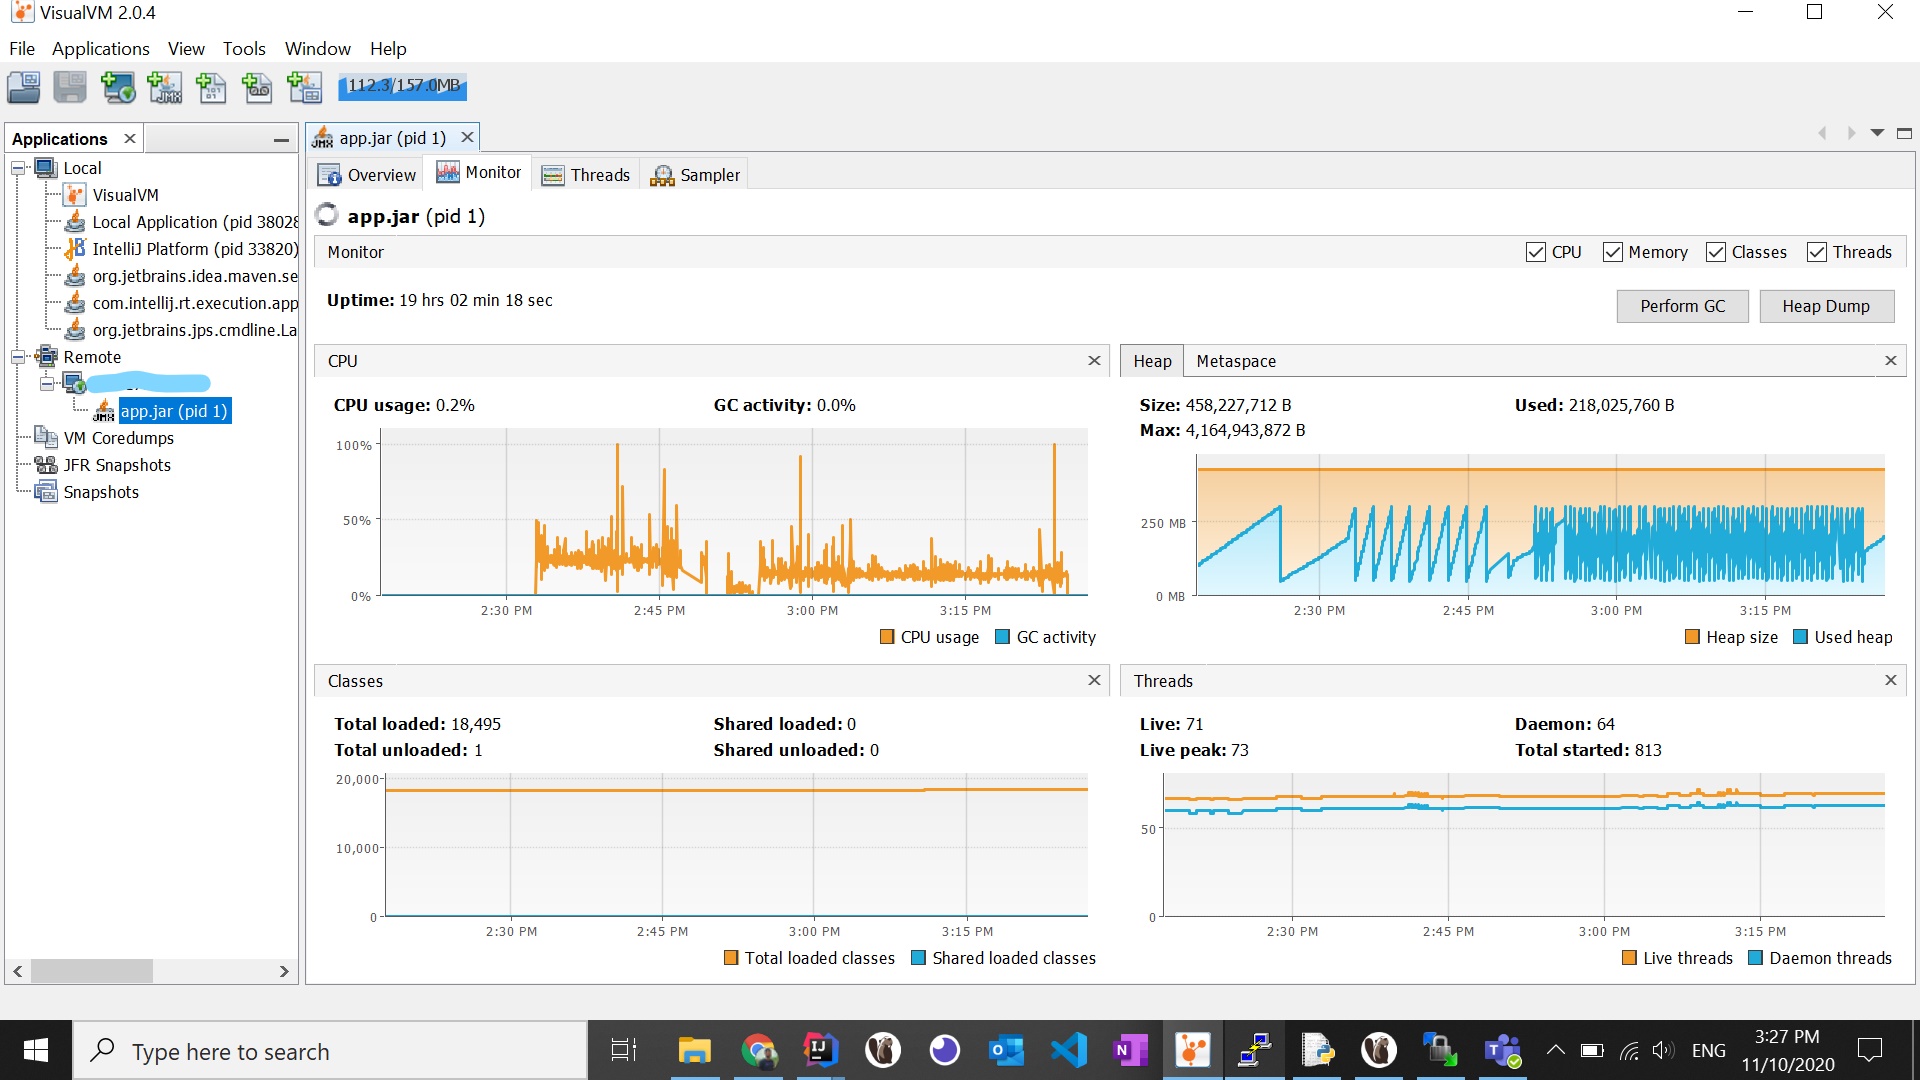
So to observe the behavior of the application , we have to monitor the JVM behavior - heap memory,live threads, cpu usage etc. There are many tools ; free and paid versions available, but I am going to use a freely shipped with JDK tool called JvisualVM. Also can download from here
Once you setup the tool start the application and monitor the JVM instance. If your application runs on host machine’s JVM then there is no need to add any configurations. Just observer the application instance.
In some cases your application might run in docker containers so we need to tunnel through the container to monitor the JVM inside. Lets add following arguments to the dockerfile , build and re-deploy.
ENTRYPOINT ["java",\
"-Dcom.sun.management.jmxremote=true", \
"-Dcom.sun.management.jmxremote.port=9080", \
"-Dcom.sun.management.jmxremote.local.only=false", \
"-Dcom.sun.management.jmxremote.authenticate=false", \
"-Dcom.sun.management.jmxremote.ssl=false", \
"-Dcom.sun.management.jmxremote.rmi.port=9080", \
"-Djava.rmi.server.hostname=host-ip", \
"-XX:+HeapDumpOnOutOfMemoryError",\
"-jar","application.jar"]
Note that you have to change the host-ip to the host machine’s IP so we can connect from our machine. Also it is important to notice that we have added -XX:+HeapDumpOnOutOfMemoryError so we can have a heapdump on OOM error. Later we will talk about how to analyse this file.
Now you can add remote jmx connection to visualvm and start monitoring. This way you can see lots of useful information about the JVM instance. That is cool , right!

If there is a growing heap , now you can identify it.
Spring Boot Actuator help
If you are working with spring boot application then there is another workaround inside the framework. It is Spring Actuator
Jou can just add the actuator dependency to the pom.xml and remove security from actuator endpoints by configuring WebSecurityConfigurationAdaptor .
<dependency>
     <groupId>org.springframework.boot</groupId>
     <artifactId>spring-boot-starter-actuator</artifactId>
</dependency>
Now add following configurations to application.properties.
management.server.port=9000
management.endpoints.web.exposure.include=*
management.endpoint.health.show-details=always
Note that you might want to restrict this management port through the proxy so that clients will not be able to access your actuator endpoints.Also you might not want to allow all endpoint in that case just define only what you want. But this demo project I go with *.
Now you are almost done!. you can see all endpoints by hitting GET http://{ip}:9000/actuator. There is an endpoint GET http://{ip}:9000/actuator/metrics with this you can see the JVM properties also. For an example if we want max heap memory size GET http://{ip}:9000/actuator/metrics/jvm.memory.max?tag=area:heap.
After monitoring all these you might come to the point that you need to see what are the growing objects inside the application, so we have to analyze the heap dump. There are two ways with you now to take a heap dump. One is to click the heap dump button in the JvisualVM and other one is calling the GET http://{ip}:9000/actuator/heapdump endpoint. So the next obvious question is how we analyze that heap dump. Nice.
Analyzing heap dump
First save the heap dump file with .hprof extension if it is not already saved that way. Next we need an analyzer tool. Here also there are commercial and open-source tools. I found that IBM Memory Analyzer is a cool tool to start with. Lets download it from here.
There are many useful features in the Heap Analyzer, what you might need at this point is Memory Leak Suspects Report. With that you can easily find out what are the growing objects in your application.
Happy Coding!